Français
 Italiano
Oorspronkelijk bestand (1.408 × 1.050 pixels, bestandsgrootte: 665 kB, MIME-type: image/jpeg)
Dit is een bestand van Wikimedia Commons. Onderstaande beschrijving komt van de beschrijving van het bestand daar. Commons is een vrij-gelicenceerde database voor afbeeldingen, geluid, video en andere bestanden. |
Beschrijving
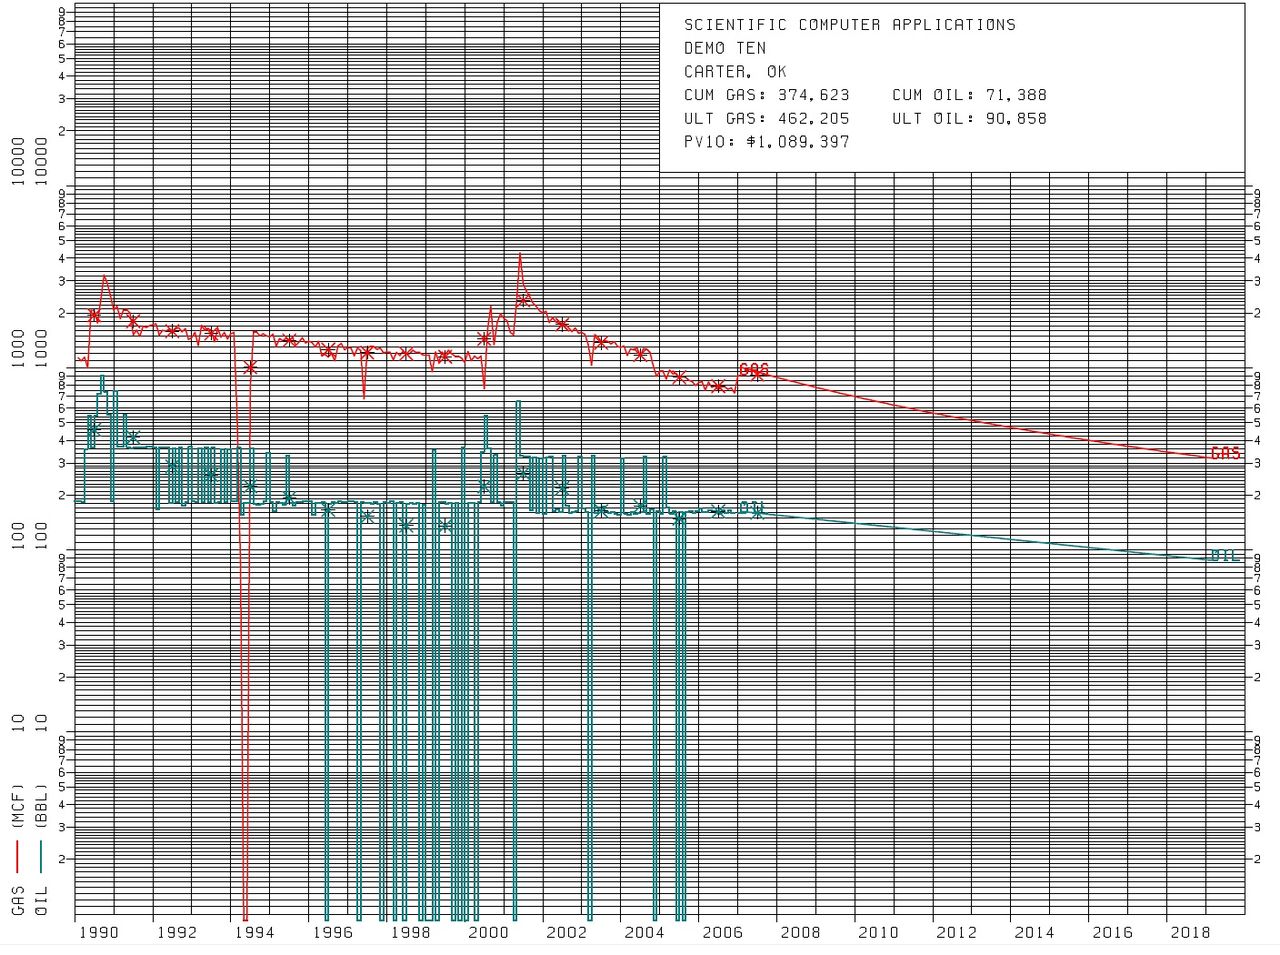
| Beschrijving | English: Decline curve generated by decline curve analysis software, utilized in oil economics and petroleum economics to indicate the depletion of oil & gas in a Petroleum reservoir. The Y axis is a semi log scale, indicating the rate of Oil depletion (green line), and gas depletion (red line). The X axis is a coordinate scale, indicating time in years and displays the production decline curve. The top red line is the gas decline curve, which is a hyperbolic decline curve. Gas is measured in MCF (Thousand cubic feet). The lower Blue line is the oil decline curve, which is an exponential decline curve. Oil is measured in BBL, or Oil barrels. Data is from actual sales, not pumped production. The dips to zero indicate there were no sales that month, likely because the Oil well did not produce a full tank, and thus was not worth a visit from a Tank truck. The upper right Legend (map) displays CUM, which is the cumulative gas or oil produced. ULT is the ultimate recovery projected for the well. Pv10 is the Discounted present value of 10%, which is the Future value of the remaining lease, valued for this oil well at $1.089 M USD. | ||
| Datum | |||
| Bron | Sent to me personally | ||
| Auteur | Richard Banks | ||
| Toestemming (Hergebruik van dit bestand) |
|

- Other information
Licentie
 | De auteursrechthebbende van dit bestand, Richard Banks, staat iedereen toe het voor willekeurig welk doel te gebruiken, mits de auteursrechthebbende correct met naam wordt genoemd. Heruitgave, afgeleide werken, commercieel gebruik en alle andere vormen van gebruik zijn toegestaan. |
Naamsvermelding: Screenshot image generated by Forecasting, Economics and Graphics System (FEGS) decline curve analysis software. [1]
|
Oorspronkelijk uploadlogboek
Verplaatst vanaf en.wikipedia naar Commons met behulp van For the Common Good.
| Datum/tijd | Afmetingen | Gebruiker | Opmerking |
|---|---|---|---|
| 05:08, 16 May 2012 | 1,408 × 1,050 (681,147 bytes) | w:en:RainmakerUSA (overleg | bijdragen) | Decline curve generated by decline curve analysis software, utilized in [[oil economics]] and [[petroleum economics]] to indicate the depletion of oil & gas in a [[Petroleum reservoir]]. The Y axis is a semi log scale, indicating the rate of [[Oil de... |
 | De categorieën op deze afbeelding moeten nagekeken worden. Kijk deze afbeelding nu na!
|
Bestandsgeschiedenis
Klik op een datum/tijd om het bestand te zien zoals het destijds was.
| Datum/tijd | Miniatuur | Afmetingen | Gebruiker | Opmerking | |
|---|---|---|---|---|---|
| huidige versie | 12 jul 2014 02:04 | | 1.408 × 1.050 (665 kB) | Josve05a | Transferred from en.wikipedia: see original upload log above |
Bestandsgebruik
Geen enkele pagina gebruikt dit bestand.
Globaal bestandsgebruik
Dit bestand wordt op de volgende andere wiki’s gebruikt:
- Gebruikt op en.wikipedia.org
- Gebruikt op es.wikipedia.org
- Gebruikt op eu.wikipedia.org
- Gebruikt op fr.wikipedia.org
- Gebruikt op ja.wikipedia.org
- Gebruikt op zh.wikipedia.org
Explore the world

United states
New York

Japan
Tokyo

Singapore
Singapore