Français
 Italiano
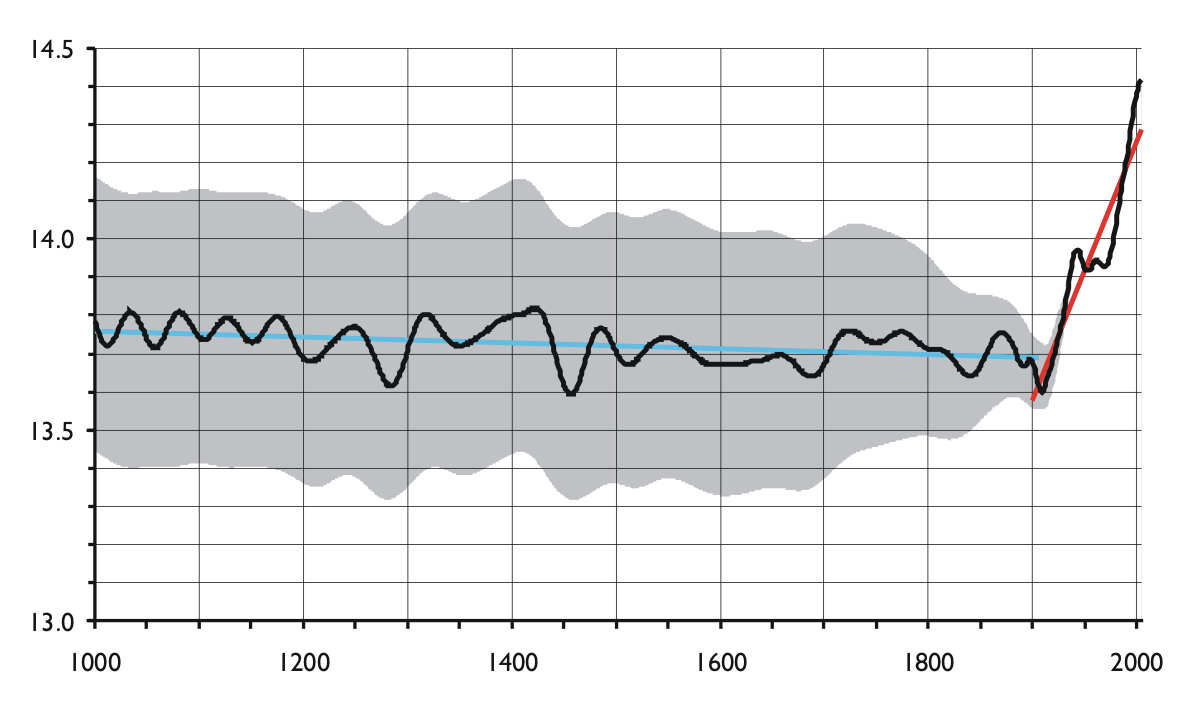
Размер этого предпросмотра: 800 × 475 пкс. Другие разрешения: 320 × 190 пкс | 640 × 380 пкс | 1200 × 712 пкс.
Исходный файл (1200 × 712 пкс, размер файла: 35 КБ, MIME-тип: image/png)
- Description: Global temperature. Axes are not labelled in order to keep the diagram language neutral; x-axis: year A.D. (1000–2004), y-axis: global temperature in °C. The black line is the smoothed global mean. The grey area is the smoothed 95% confidence interval of the estimates. The blue line is the regression line for the period 1000–1899. The red line is the regression line for the period 1900–2004.
The diagram illustrates several aspects of global warming. The rapid increase (as well as the earlier slow decrease) is statistically highly significant. One can also see that the 1990s most probably have been the last millenium's warmest decade.
Caution is required in interpretation, however, because the data prior to 1881 are estimates based on proxies (such as tree rings and ice cores). This makes both the accuracy and the temporal resolution of the estimates poorer than for the last century. Single years most certainly lay outside the confidence intervals. This does probably not affect the above conclusion about the 1990 decade, however. - Source: graph drawn by Hanno using data from two sources. For the years 1000–1880, temperature estimates were taken from P.D. Jones & M.E. Mann (2004): "Climate over past millenia". Reviews of Geophysics, 42, article number RG2002. For the remainder, temperatures are based on instrumental records published on the web by P.D. Jones, D.E. Parker, T.J. Osborn & K.R. Briffa (2005) as "Global and hemispheric temperature anomalies – land and marine instrumental records". In Trends: A Compendium of Data on Global Change. Carbon Dioxide Information Analysis Center, Oak Ridge National Laboratory, U.S. Department of Energy, Oak Ridge, Tenn., U.S.A. [http://cdiac.esd.ornl.gov/trends/temp/jonescru/jones.html archive copy at the Wayback Machine]
- Licence: released into the public domain by the originator
| Я, владелец авторских прав на это произведение, передаю его в общественное достояние. Это разрешение действует по всему миру. В некоторых странах это не может быть возможно юридически, в таком случае: Я даю право кому угодно использовать данное произведение в любых целях без каких-либо условий, за исключением таких условий, которые требуются по закону. |
 | Этот график желательно воссоздать или аккуратно преобразовать в векторный формат SVG. Это даёт несколько преимуществ, прочитать о которых подробнее вы можете на странице Commons:Media for cleanup. Если вам уже сейчас доступна векторная версия данного изображения, загрузите её, пожалуйста, а затем замените этот шаблон на следующий: {{Vector version available|Имя загруженного файла.svg}}. |
История файла
Нажмите на дату/время, чтобы увидеть версию файла от того времени.
| Дата/время | Миниатюра | Размеры | Участник | Примечание | |
|---|---|---|---|---|---|
| текущий | 18:49, 9 ноября 2005 | | 1200 × 712 (35 КБ) | Hanno |
Использование файла
Нет страниц, использующих этот файл.
Глобальное использование файла
Данный файл используется в следующих вики:
- Использование в fr.wikipedia.org
- Использование в ja.wikipedia.org
Explore the world

United states
New York

Japan
Tokyo

Singapore
Singapore